Astrophysics Example 1
In this example we will use BoxKit to work with three dimensional astrophysics data. After performing the required installation steps we are read to import BoxKit into Python environment
import boxkit
Next we read and parse dataset information from a HDF5 file,
25m_3d_32km_hdf5_plt_cnt_1000, that contains Flash-X simulation
output
dset = boxkit.read_dataset("25m_3d_32km_hdf5_plt_cnt_1000", source="flash")
We can probe into the information for this dataset by using a simple print statement
print(dset)
Dataset:
 - type         : <class 'boxkit.library._dataset.Dataset'>
 - file         : <HDF5 file "25m_3d_32km_hdf5_plt_cnt_1000" (mode r)>
 - keys         : ['dens', 'temp', 'velx', 'vely', 'ye  ', 'fe54', 'fe56', 'o16 ', 'si28', 'entr', 'enuc', 'cr48', 'cr56', 'fe52', 'ni56', 'pres', 'c12 ', 's32 ', 'gpot', 'gamc', 'dtbn', 'velz']
 - dtype    : [<class 'h5pickle.Dataset'>, <class 'h5pickle.Dataset'>, <class 'h5pickle.Dataset'>, <class 'h5pickle.Dataset'>, <class 'h5pickle.Dataset'>, <class 'h5pickle.Dataset'>, <class 'h5pickle.Dataset'>, <class 'h5pickle.Dataset'>, <class 'h5pickle.Dataset'>, <class 'h5pickle.Dataset'>, <class 'h5pickle.Dataset'>, <class 'h5pickle.Dataset'>, <class 'h5pickle.Dataset'>, <class 'h5pickle.Dataset'>, <class 'h5pickle.Dataset'>, <class 'h5pickle.Dataset'>, <class 'h5pickle.Dataset'>, <class 'h5pickle.Dataset'>, <class 'h5pickle.Dataset'>, <class 'h5pickle.Dataset'>, <class 'h5pickle.Dataset'>, <class 'h5pickle.Dataset'>]
 - bound(z-y-x) : [-10000000000.0, 10000000000.0] x [-10000000000.0, 10000000000.0] x [-10000000000.0, 10000000000.0]
 - shape(z-y-x) : 8 x 8 x 8
 - guard(z-y-x) : 0 x 0 x 0
 - nblocks      : 90200
 - dtype        : {'dens': <class 'h5pickle.Dataset'>, 'temp': <class 'h5pickle.Dataset'>, 'velx': <class 'h5pickle.Dataset'>, 'vely': <class 'h5pickle.Dataset'>, 'ye  ': <class 'h5pickle.Dataset'>, 'fe54': <class 'h5pickle.Dataset'>, 'fe56': <class 'h5pickle.Dataset'>, 'o16 ': <class 'h5pickle.Dataset'>, 'si28': <class 'h5pickle.Dataset'>, 'entr': <class 'h5pickle.Dataset'>, 'enuc': <class 'h5pickle.Dataset'>, 'cr48': <class 'h5pickle.Dataset'>, 'cr56': <class 'h5pickle.Dataset'>, 'fe52': <class 'h5pickle.Dataset'>, 'ni56': <class 'h5pickle.Dataset'>, 'pres': <class 'h5pickle.Dataset'>, 'c12 ': <class 'h5pickle.Dataset'>, 's32 ': <class 'h5pickle.Dataset'>, 'gpot': <class 'h5pickle.Dataset'>, 'gamc': <class 'h5pickle.Dataset'>, 'dtbn': <class 'h5pickle.Dataset'>, 'velz': <class 'h5pickle.Dataset'>}
The dataset contains 90200 blocks each of size 8x8x8, along with
variables listed in keys. We can now use this dataset to create a
slice at location y = 0.1
yloc = 0.1
dset_slice = boxkit.create_slice(dset, ymin=yloc, ymax=yloc)
print(dset_slice)
Region:
 - type          : <class 'boxkit.library._slice.Slice'>
 - bound (z-y-x) : [-10000000000.0, 10000000000.0] x [0.0, 1666666624.0] x [-10000000000.0, 10000000000.0]
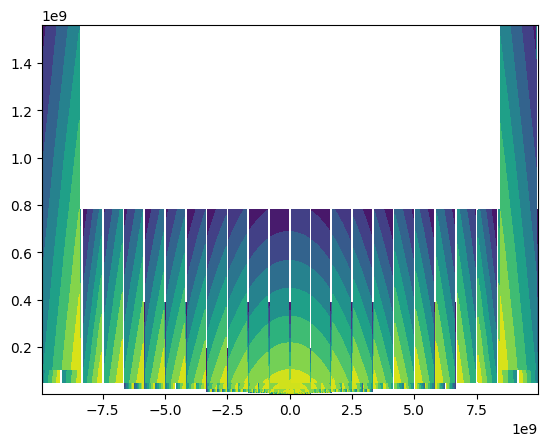
Now we can loop over blocks in this slice and extract data from right indices
# import required libraries
import numpy
import matplotlib.pyplot as pyplot

# create a pyplot figure object
pyplot.figure()

# Name of the contour variable
cvar = "temp"

# Initialize min/max values
min_cval = 1e10
max_cval = -1e10

# loop over blocks for blocklist included in the slice
for block in dset_slice.blocklist:

    # Get y-index closest to the probe location
    yindex = (numpy.abs(block.yrange("center") - yloc)).argmin()

    # Create a mesh grid in x-z plane
    xmesh, zmesh = numpy.meshgrid(block.xrange("center"), block.yrange("center"))

    # plot contour
    pyplot.contourf(xmesh,zmesh,block[cvar][:,yindex,:])

    min_cval = min(numpy.min(block[cvar][:,yindex,:]), min_cval)
    max_cval = max(numpy.max(block[cvar][:,yindex,:]), max_cval)

#pyplot.colorbar()
#pyplot.clim(min_cval,max_cval)