Pool Boiling Gravity
In this tutorial we will learn how to perform complex plotting and slicing operations using two and three dimensional pool boiling datasets. We consider two studies invovling different gravity environments - earth and low gravity.
Lets begin!
First we import all the necessary libraries
import math
import numpy
import boxkit
import matplotlib.pyplot as pyplot
First we will look at how to merge block-structured datasets into
contiguous arrays to using boxkit.mergeblocks method.
Lets start with reading the relevant datasets,
dataset_blocks=boxkit.read_dataset("/Users/Akash/Box/Jarvis-DataShare/Bubble-Box-Sample/boiling-earth/heater2D/blocks/INS_Pool_Boiling_Heater_hdf5_0030")
dataset_oneblk=boxkit.read_dataset("/Users/Akash/Box/Jarvis-DataShare/Bubble-Box-Sample/boiling-earth/heater2D/oneblk/INS_Pool_Boiling_Heater_hdf5_0030")
dataset_blocks contains a two-dimensional results of a heater
surface in a pool boiling simulations in earth gravity, where the
variable, phi, is a level-set function representing bubble locations.
dataset_oneblk contains the same dataset as a contiguous array to
compare with a reference solution
We start by defining a method plot_phi to plot a contour plot for
phi=0 over list of blocks in a dataset
def plot_phi(dataset):
    """
    dataset: BoxKit dataset object
    """
    # create figure with desired configuration
    pyplot.figure(figsize=[6,6])
    pyplot.rc("font", family="serif", size=14, weight="bold")
    pyplot.rc("axes", labelweight="bold", titleweight="bold")
    pyplot.rc("text", usetex=True)

    # loop over blocks in dataset
    for block in dataset.blocklist:

        # create a mesh grid in x-z plane
        xmesh, zmesh = numpy.meshgrid(block.xrange("center"), block.zrange("center"))
        pyplot.contour(xmesh, zmesh, block["phi"][:,0,:], levels=[0])

    # set layout and plot titles
    pyplot.tight_layout()
    pyplot.xlim([dataset.xmin, dataset.xmax])
    pyplot.ylim([dataset.zmin, dataset.zmax])
    pyplot.title("Heater X-Z Plane")
    pyplot.show()
Next we supply each dataset to plot the bubbles on a heater surface using the function defined above
plot_phi(dataset_oneblk)
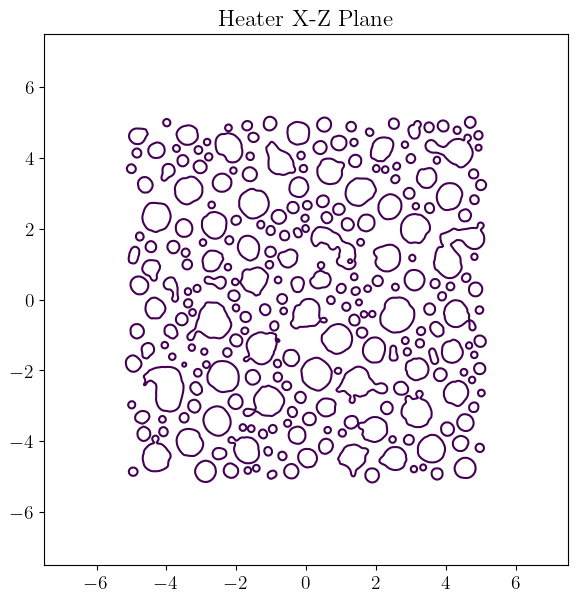
plot_phi(dataset_blocks)
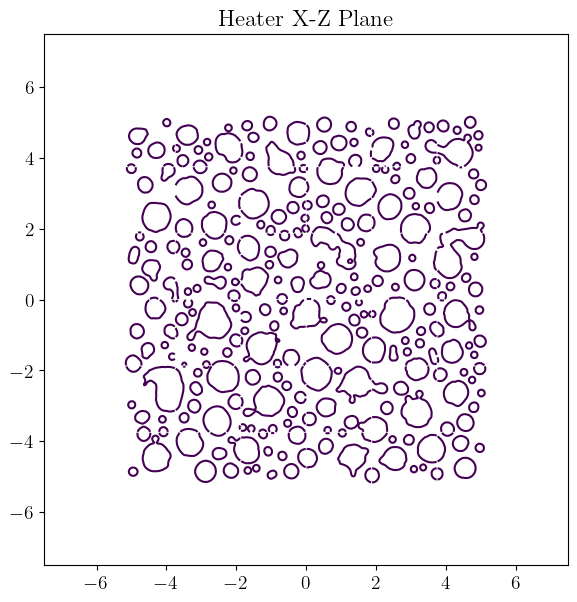
We can see how plotting contours for dataset_blocks creates breaks
due in the lines for phi=0. This can be resolved by merging blocks using
boxkit.mergeblocks method.
reshaped_dataset=boxkit.mergeblocks(dataset_blocks, "phi", nthreads=1, backend="loky")
boxkit.mergeblocks can be called with multiple threads and desired
parallel backend to control the speed of this method and create
reshaped_dataset as a new merged dataset. The resulting plot for
this dataset is similar plot for dataset_oneblk
plot_phi(reshaped_dataset)

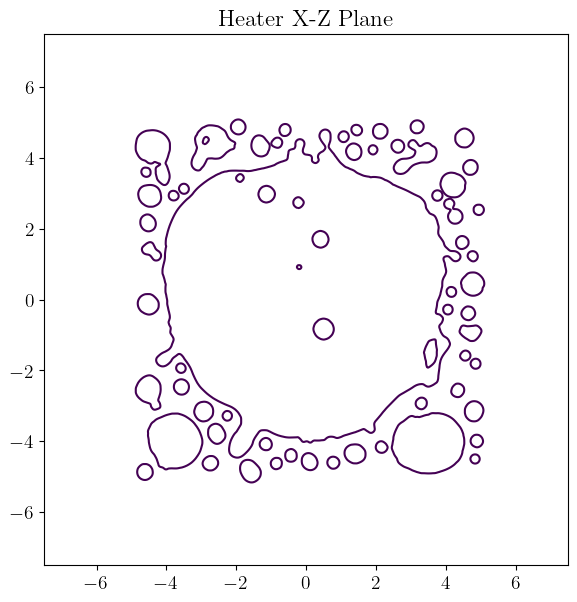
We apply the the same process for a pool boiling simulation for low gravity (international space station)
dataset_lowg=boxkit.read_dataset("/Users/Akash/Box/Jarvis-DataShare/Bubble-Box-Sample/boiling-lowg/heater2D/INS_Pool_Boiling_Heater_hdf5_0030")
dataset_lowg=boxkit.mergeblocks(dataset_lowg, "phi")
plot_phi(dataset_lowg)
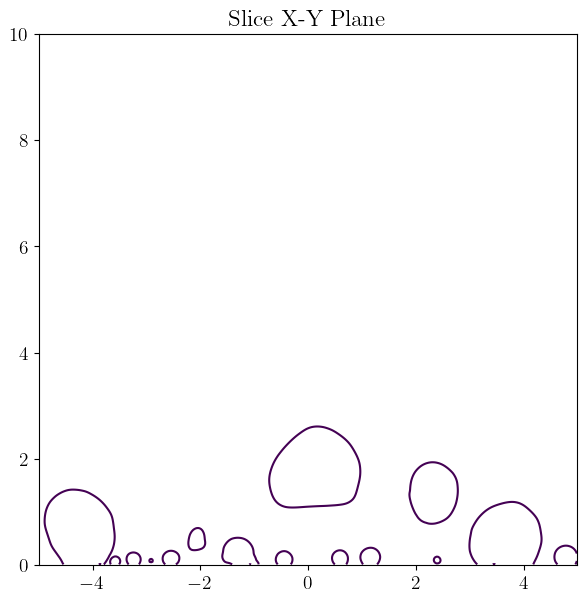
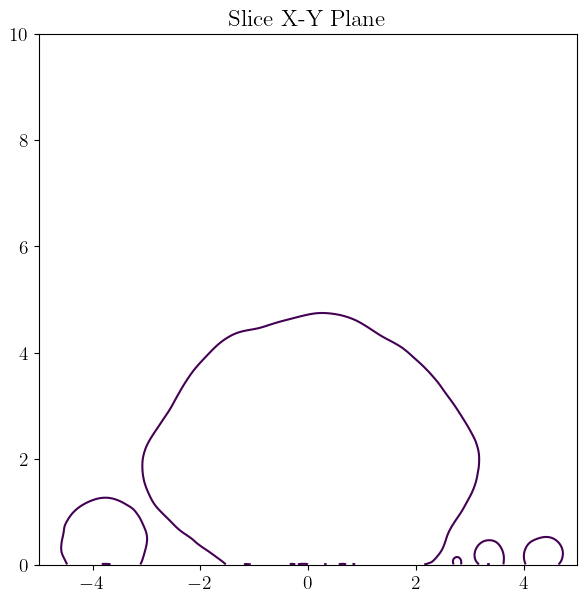
We can apply similar process to a three-dimensional dataset and create contour plots along slices as follows,
def plot_phi_3D(dataset):
    pyplot.figure(figsize=[6,6])
    pyplot.rc("font", family="serif", size=14, weight="bold")
    pyplot.rc("axes", labelweight="bold", titleweight="bold")
    pyplot.rc("text", usetex=True)
    for block in dataset.blocklist:
        xmesh, ymesh = numpy.meshgrid(block.xrange("center"), block.yrange("center"))
        pyplot.contour(xmesh, ymesh, block["phi"][50,:,:], levels=[0])
    pyplot.tight_layout()
    pyplot.xlim([dataset.xmin, dataset.xmax])
    pyplot.ylim([dataset.ymin, dataset.ymax])
    pyplot.title("Slice X-Y Plane")
    pyplot.show()
dataset_3D=boxkit.read_dataset("/Users/Akash/Box/Jarvis-DataShare/Bubble-Box-Sample/boiling-earth/domain3D/not-chunked/INS_Pool_Boiling_hdf5_0030")
dataset_3D=boxkit.mergeblocks(dataset_3D, "phi", monitor=True, nthreads=1, backend="loky")
plot_phi_3D(dataset_3D)
dataset_3D=boxkit.read_dataset("/Users/Akash/Box/Jarvis-DataShare/Bubble-Box-Sample/boiling-lowg/domain3D/INS_Pool_Boiling_hdf5_0030")
dataset_3D=boxkit.mergeblocks(dataset_3D, "phi", monitor=True, nthreads=2, backend="loky")
plot_phi_3D(dataset_3D)
dataset_blocks.purge("boxmem")
dataset_oneblk.purge("boxmem")
reshaped_dataset.purge("boxmem")
dataset_lowg.purge("boxmem")
dataset_3D.purge("boxmem")